
Analytics Page
Monitor agent performance, analyze credit usage, and track HTTP request statistics in real-time
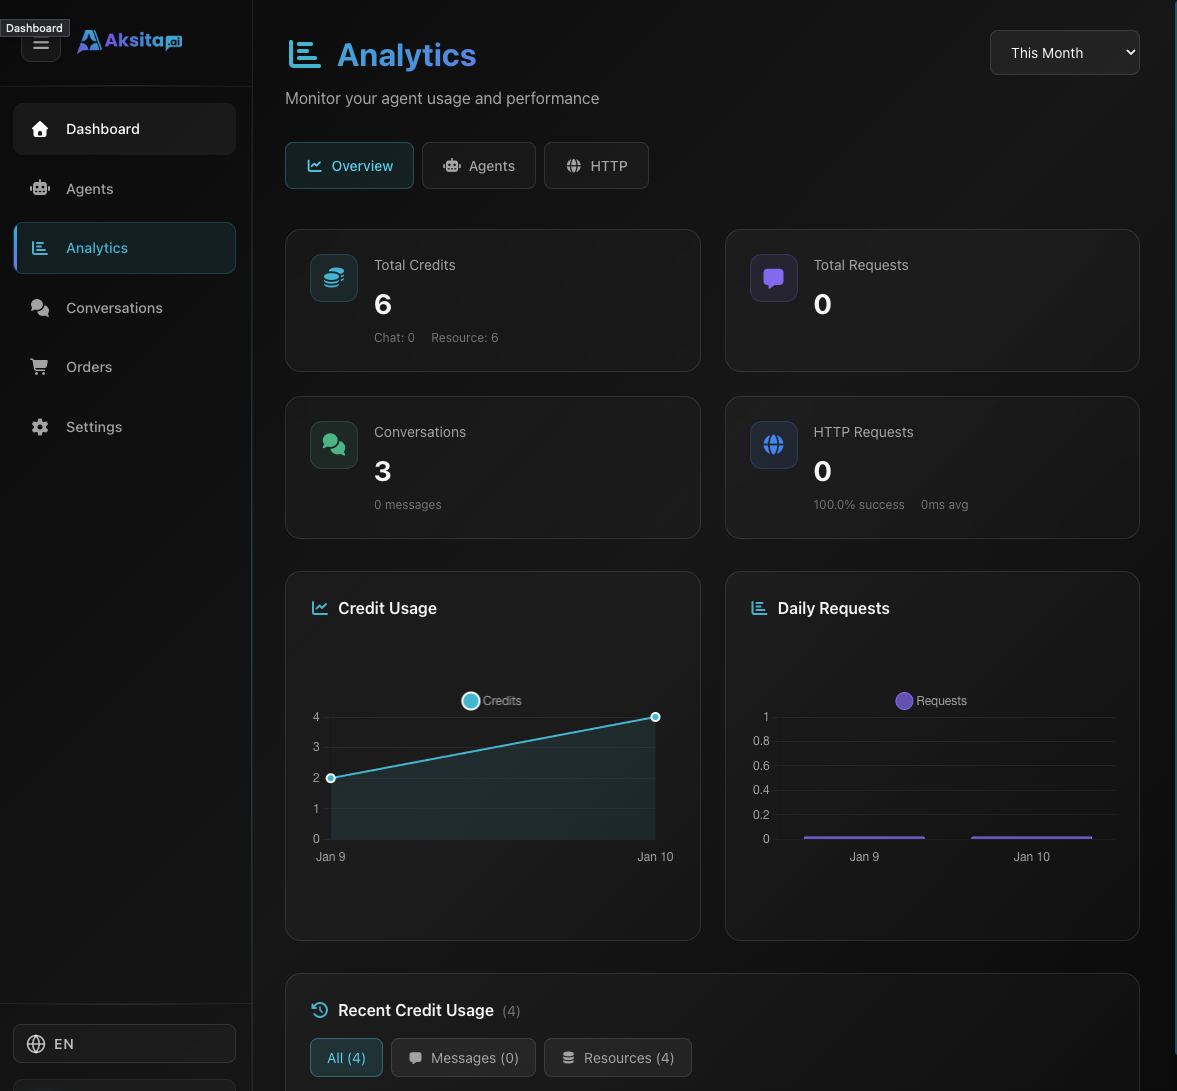
Screenshot: Dashboard Analytics
Screenshot: Dashboard Analytics
About Analytics
The Analytics page provides deep insights into your agent usage, including credits consumed, request volume, and HTTP action performance. This data helps you optimize agents and control costs.
Key Metrics:
- Total Credits Used: Total credits consumed (Chat + Resource)
- Total Requests: Number of requests processed
- Agent Statistics: Performance per agent
- HTTP Request Stats: Success rate and execution time
Overview Tab
The Overview tab displays key statistics in cards and charts:
Credit Usage
Time Series Charts
Visualize credit usage and request volume over time to understand trends and usage patterns.
HTTP Request Statistics
Agents Tab
The Agents tab displays per-agent statistics breakdown in table format:
Agent Data Columns:
Use this data to identify which agents are most used and consuming the most credits.
HTTP Requests Tab
The HTTP Requests tab displays detailed performance of HTTP actions and knowledge bases:
Resource HTTP Stats
Statistics per resource using HTTP (KB URL, HTTP, Sitemap, Domain, or HTTP Actions):
HTTP Request Logs
Detailed log of each HTTP request made, including:
- • Request timestamp
- • Resource name and type
- • HTTP method and URL
- • Response status code
- • Execution time (ms)
- • Success/Error status
Performance Tip: If success rate is low or execution time is high, check resource configuration or external API stability.
Leveraging Analytics Data
Cost Optimization
Monitor credit usage to avoid overspending. Identify agents that are too costly and optimize their configuration.
Trend Analysis
Use time series charts to understand peak usage times and plan capacity scaling.
Performance Monitoring
Track HTTP success rate and execution time to ensure agent responses are fast and reliable.
User Behavior
View conversation and message counts to understand engagement levels and popular questions.
Monitoring Tips
Regular Check
Review analytics at least weekly to catch issues early.
Set Alerts
Monitor credit usage and set reminders before running out.
Compare Agents
Compare performance across agents for best practices.
Debug Issues
Use HTTP logs to troubleshoot failed requests.