
Analytics
Monitor credit usage, agent performance, and HTTP requests
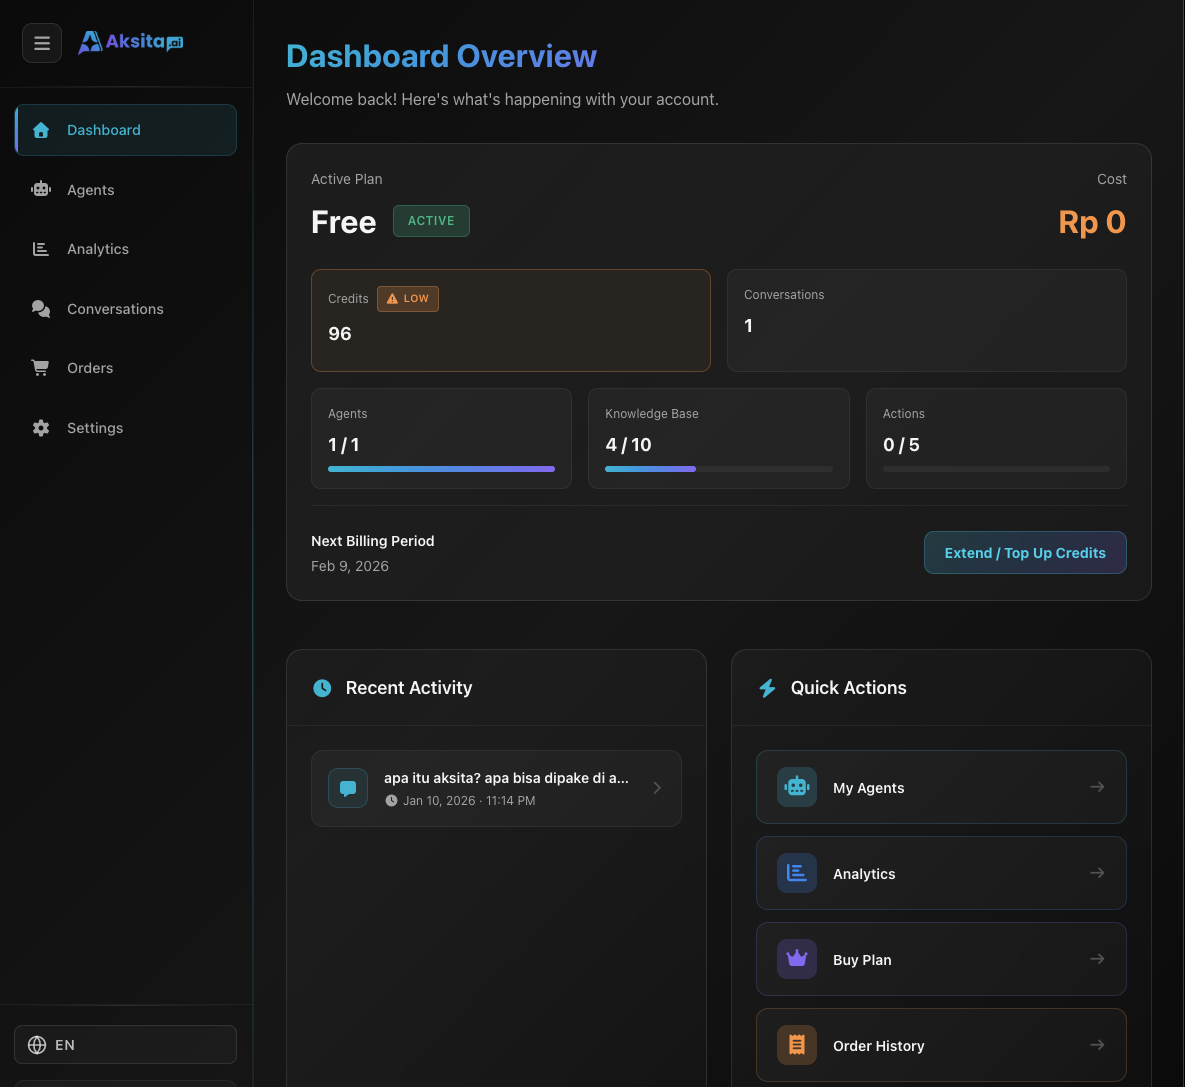
Screenshot: Analytics & Reports
Screenshot: Analytics & Reports
About Analytics
Analytics helps you understand how your agent is used, how many credits are consumed, and HTTP resource performance. Use this data for optimization and monitoring.
Period Filter
Select time period to view analytics data:
Today's data only
Last 7 days
Last 30 days (default)
Last 12 months
Select start and end dates
Overview Tab
Overview tab displays key metrics and data visualizations:
1. Stat Cards
Total credits used (Chat + Resource breakdown). Shows trend compared to previous period.
Total number of requests (chat messages) with trend percentage.
Total conversations and number of messages within them.
Total HTTP requests, success rate, and average execution time.
2. Time Series Charts
Line chart showing credit usage over time.
Bar chart showing number of requests per day.
3. Usage by Agent (Top 5)
Displays top 5 agents by total credits and requests.
4. Recent Credit Usage
Displays last 100 entries (messages + resources). Can be filtered:
Agents Tab
Agents tab displays detailed statistics per agent with 3 metric categories:
1. General
Combined chat + resource credits. Total consumption per agent.
Number of knowledge bases & actions linked to agent.
2. Chat
Total number of chat requests (messages from users).
Credits for LLM inference (excluding KB).
Average credits per chat. To check efficiency.
Number of unique conversations (sessions).
3. Resource
KB operations (create/update documents).
Credits for processing/indexing KB.
Average credits per resource operation.
Search & Pagination Feature
Agents tab includes search box to find specific agents and pagination for navigating large datasets.
HTTP Requests Tab
HTTP Requests tab displays performance and logs from HTTP actions/knowledge bases:
1. Summary Stats
2. Per Resource Stats
Table displays stats per HTTP resource (action/KB):
- Resource name
- Requests, Successful, Failed count
- Success rate percentage
- Average execution time (ms)
Click row to view detailed logs
3. Recent HTTP Logs
Displays recent HTTP request logs (100 per page):
- Success/error status with icon
- Resource name and agent name
- Execution time and timestamp
- Error message (if any)
Logs can be filtered per resource by clicking table above
Tips for Using Analytics
Check analytics regularly to understand usage patterns and identify issues early.
Watch Avg/Chat and Avg/Res metrics. If high, consider optimizing prompts or resource size.
Success rate < 90% needs attention. Check logs to identify error patterns and fix configurations.
Trend indicators (+12%, -5%) show changes from previous period. Useful for tracking growth.